Styles, colors and color maps
Main author: Maël Godard
Colors
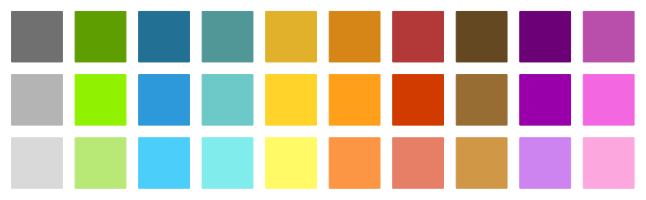
Predefined colors are available in the Color class. Each of the static methods can take an argument to define the transparency of the color between 0 (full transparency) and 1 (full opacity).
Color.none(), Color.white(), Color.black()
Color.light_gray(), Color.gray(), Color.dark_gray()
Color.light_green(), Color.green(), Color.dark_green()
Color.light_blue(), Color.blue(), Color.dark_blue()
Color.light_cyan(), Color.cyan(), Color.dark_cyan()
Color.light_yellow(), Color.yellow(), Color.dark_yellow()
Color.light_orange(), Color.orange(), Color.dark_orange()
Color.light_red(), Color.red(), Color.dark_red()
Color.light_brown(), Color.brown(), Color.dark_brown()
Color.light_purple(), Color.purple(), Color.dark_purple()
Color.light_pink(), Color.pink(), Color.dark_pink()
Color::none(), Color::white(), Color::black()
Color::light_gray(), Color::gray(), Color::dark_gray()
Color::light_green(), Color::green(), Color::dark_green()
Color::light_blue(), Color::blue(), Color::dark_blue()
Color::light_cyan(), Color::cyan(), Color::dark_cyan()
Color::light_yellow(), Color::yellow(), Color::dark_yellow()
Color::light_orange(), Color::orange(), Color::dark_orange()
Color::light_red(), Color::red(), Color::dark_red()
Color::light_brown(), Color::brown(), Color::dark_brown()
Color::light_purple(), Color::purple(), Color::dark_purple()
Color::light_pink(), Color::pink(), Color::dark_pink()
Color().none(), Color().white(), Color().black()
Color().light_gray(), Color().gray(), Color().dark_gray()
Color().light_green(), Color().green(), Color().dark_green()
Color().light_blue(), Color().blue(), Color().dark_blue()
Color().light_cyan(), Color().cyan(), Color().dark_cyan()
Color().light_yellow(), Color().yellow(), Color().dark_yellow()
Color().light_orange(), Color().orange(), Color().dark_orange()
Color().light_red(), Color().red(), Color().dark_red()
Color().light_brown(), Color().brown(), Color().dark_brown()
Color().light_purple(), Color().purple(), Color().dark_purple()
Color().light_pink(), Color().pink(), Color().dark_pink()
Each basic color is available in three shades: light_, normal and dark_:
Custom colors can be defined in the RGB or HSV color spaces. An enumeration Model is used to make the distinction between the two.
Model.RGB # RGB color space
Model.HSV # HSV color space
Model::RGB; // RGB color space
Model::HSV; // HSV color space
Model().RGB % RGB color space
Model().HSV % HSV color space
A getter model() is available, and the methods rgb() and hsv() are used to do the conversion between the two color spaces.
If the color is in RGB then the red, green, blue and alpha values are between 0 and 255. If the color is in HSV then the hue value is between 0 and 360 while the saturation, value and alpha values are between 0 and 100.
The Color class constructor can take different arguments:
no argument : black color
an array of 3 floats and a
Model(default is RGB): the RGB or HSV valuesan array of 4 floats and a
Model(default is RGB): the RGBA or HSVA values and the transparencya list of 3 or 4 floats and a
Model(default is RGB): the RGB, HSV, RGBA or HSVA valuesa string : the HTML representation of the color (e.g. “#FF0000” for red)
Additionnal methods are available for any useful purpose:
hex_str(): the html representation of the colorvec(): the RGBA or HSVA values in a vector
Color creation example :
# Predefined colors without and with opacity
fig.draw_point([2,2], [Color.red(),Color.yellow(0.5)])
# HTML color without and with opacity
fig.draw_box([[2.4,2.9],[2.4,2.9]], [Color("#da3907"),Color("#da390755")])
# HSV color without and with opacity
fig.draw_box([[2.6,3.1],[2.6,3.1]], [Color([108,90,78],Model.HSV),Color([108,90,78,20],Model.HSV)])
// Predefined colors without and with opacity
fig.draw_point({2,2}, {Color::red(),Color::yellow(0.5)});
// HTML color without and with opacity
fig2.draw_box({{2.4,2.9}, {2.4,2.9}}, {Color("#da3907"),Color("#da390755")});
// HSV color without and with opacity
fig2.draw_box({{2.6,3.1},{2.6,3.1}}, {Color({108,90,78},Model::HSV),Color({108,90,78,20},Model::HSV)});
% predefined colors without and with opacity
fig.draw_point(Vector({2,2}), StyleProperties({Color().red(),Color().yellow(0.5)}));
% HTML color without and with opacity
fig.draw_box(IntervalVector({{2.4,2.9},{2.4,2.9}}),StyleProperties({Color("#da3907"),Color("#da390755")}));
% HSV color without and with opacity
fig.draw_box(IntervalVector({{2.6,3.1},{2.6,3.1}}),StyleProperties({Color({108,90,78},Model().HSV),Color({108,90,78,20},Model().HSV)}));
StyleProperties
By default, the drawn shapes will have a black edge and no fill. A StyleProperties object can be passed as an additionnal argument to change it.
Predefined styles are available in the StyleProperties class:
inside(): dark-gray edge, green filloutside(): dark-gray edge, light blue fillboundary(): dark-gray edge, yellow fill
A StyleProperties object is composed of two Color objects, one for the edge and one for the fill. Three constructors are available:
default_style = StyleProperties() # default
edge_style = StyleProperties(Color.red()) # edge only
edge_fill_style = StyleProperties([Color.blue(),Color.green()]) # edge and fill
StyleProperties default_style; // default
StyleProperties edge_style(Color::red()); // edge only
StyleProperties edge_fill_style({Color::blue(),Color::green()}); // edge and fill
default_style = StyleProperties() % default
edge_style = StyleProperties(Color().red()) % edge only
edge_fill_style = StyleProperties({Color().blue(),Color().green()}) % edge and fill
It can also be deduced from one or two Color objects.
fig.draw_box([[2,5],[2,5]]) # Default style
fig.draw_box([[2,5],[2,5]], StyleProperties.inside()) # dark-gray edge, green fill
fig.draw_box([[2,5],[2,5]], Color.red()) # red edge, no fill
fig.draw_box([[2,5],[2,5]], [Color.blue(),Color.green()]) # blue edge, green fill
fig.draw_box({{2,5},{2,5}}); // Default style
fig.draw_box({{2,5},{2,5}}, StyleProperties::inside()); // dark-gray edge, green fill
fig.draw_box({{2,5},{2,5}}, Color::red()); // red edge, no fill
fig.draw_box({{2,5},{2,5}}, {Color::blue(),Color::green()}); // blue edge, green fill
fig.draw_box(IntervalVector({{2.2,2.5},{2.2,2.5}}));
fig.draw_box(IntervalVector({{2.2,2.5},{2.2,2.5}}),StyleProperties().inside());
fig.draw_box(IntervalVector({{2.2,2.5},{2.2,2.5}}),Color().red());
fig.draw_box(IntervalVector({{2.2,2.5},{2.2,2.5}}),StyleProperties({Color().blue(),Color().green()}));
In addition, optional arguments can be passed to the StyleProperties object to define line style, line width, layer and Z-value.
For more information, see Optional arguments.
fig.draw_box([[2,5],[2,5]], StyleProperties(Color.red(), "..", "layer1", "w:0.1", "z:1.5"))
# Red edge, dotted line, line width of 0.1, z-value of 1.5 and on layer1
fig.draw_box({{2,5},{2,5}}, StyleProperties(Color::red(), "..", "layer1", "w:0.1", "z:1.5"));
// Red edge, dotted line, line width of 0.1, z-value of 1.5 and on layer1
fig.draw_box(IntervalVector({{2,5},{2,5}}), StyleProperties(Color().red(), "..", "layer1", "w:0.1", "z:1.5"));
% Red edge, dotted line, line width of 0.1, z-value of 1.5 and on layer1
Color maps
Color maps are used to convert a scalar value (between 0 and 1) to a color. The ColorMap class provides a set of predefined color maps:
ColorMap.basic() # default color map
ColorMap.haxby() # Haxby color map
ColorMap.rainbow() # rainbow color map
ColorMap.blue_tube() # blue color map, used mainly for tubes
ColorMap.red_tube() # red color map, used mainly for tubes
ColorMap::basic(); // default color map
ColorMap::haxby(); // Haxby color map
ColorMap::rainbow(); // rainbow color map
ColorMap::blue_tube(); // blue color map, used mainly for tubes
ColorMap::red_tube(); // red color map, used mainly for tubes
ColorMap().basic(); % default color map
ColorMap().haxby(); % Haxby color map
ColorMap().rainbow(); % rainbow color map
ColorMap().blue_tube(); % blue color map, used mainly for tubes
ColorMap().red_tube(); % red color map, used mainly for tubes
These five color maps are displayed below:
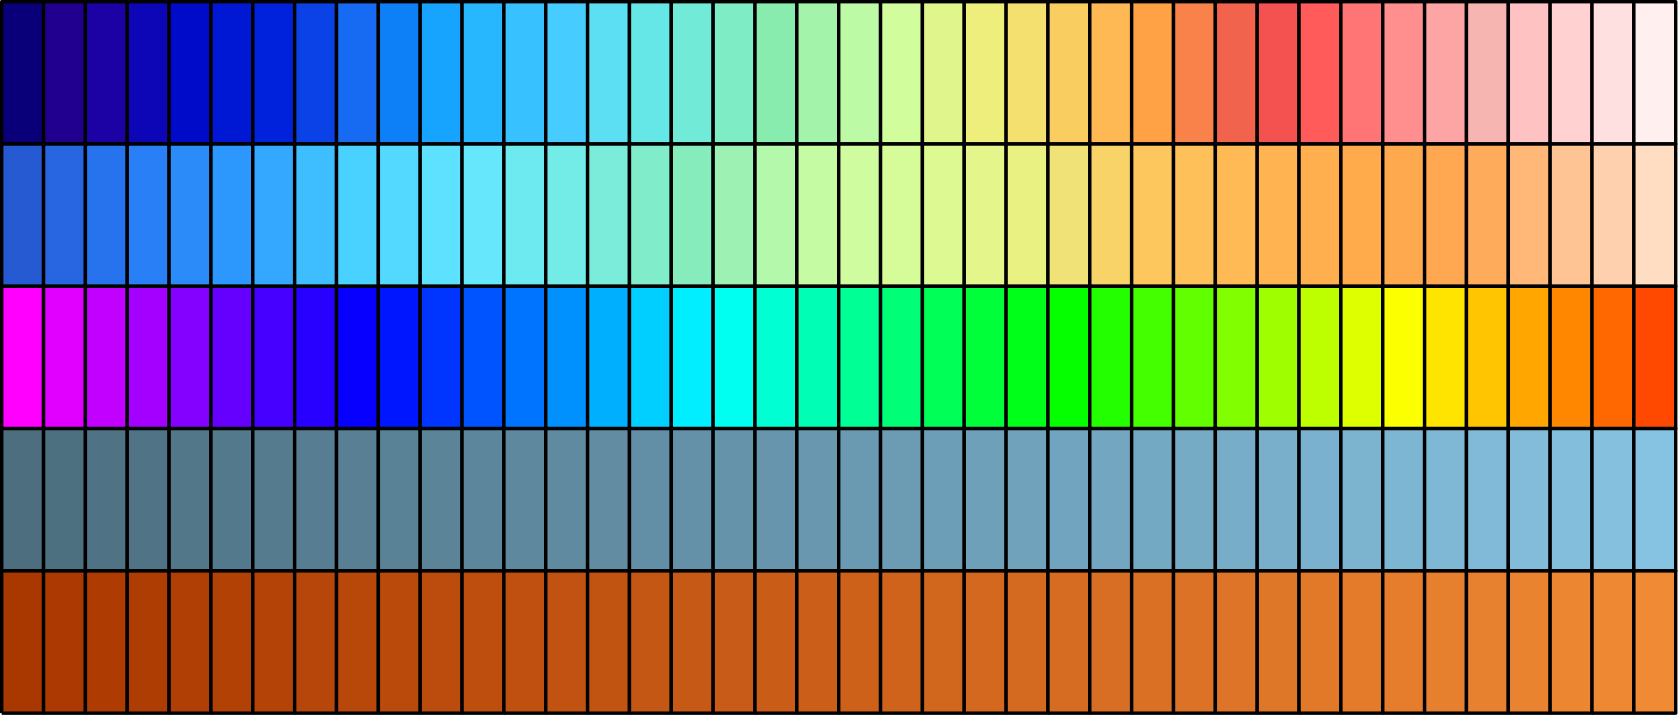
A paramater alpha can be passed to the predefined color maps to set the opacity of the colors (between 0 and 1). The default value is 1 (full opacity).
# Create a haxby color map with 50% opacity
cmap = ColorMap.haxby(0.5)
// Create a haxby color map with 50% opacity
ColorMap cmap = ColorMap::haxby(0.5);
% Create a haxby color map with 50% opacity
cmap = ColorMap.haxby(0.5)
The method color() is used to get the color corresponding to a scalar value. The argument is a float between 0 and 1.
As for the Color class, the ColorMap also has a Model (RGB or HSV) and an associated getter model(). The default Model is RGB.
You can also create your own color map :
# Create a custom color map
custom_map = ColorMap(Model.RGB)
custom_map[0] = Color([255,0,0])
custom_map[0.5] = Color([0,255,0])
custom_map[1] = Color([0,0,255])
// Create a custom color map
ColorMap custom_map(Model::RGB);
custom_map[0] = Color({255,0,0});
custom_map[0.5] = Color({0,255,0});
custom_map[1] = Color({0,0,255});
% Create a custom color map
custom_map = ColorMap(Model().RGB);
custom_map.set_item(0,Color({255,0,0}));
custom_map.set_item(0.5,Color({0,255,0}));
custom_map.set_item(1,Color({0,0,255}));
Note that you can add RGB and HSV colors to the same color map. The model of the color map will define the interpolation space.
StyleGradientProperties
Some shapes can be drawn with a color map (trajectories, tubes, …). By default, the drawn shapes will use the basic color map.
A StyleGradientProperties object can be passed as an additionnal argument to change it.
A StyleGradientProperties object involves a ColorMap. Two constructors are available:
default_style = StyleGradientProperties() # default
custom_style = StyleGradientProperties(ColorMap.haxby()) # haxby color map
StyleGradientProperties default_style; // default
StyleGradientProperties custom_style(ColorMap::haxby()); // haxby color map
default_style = StyleGradientProperties() % default
custom_style = StyleGradientProperties(ColorMap().haxby()) % haxby color map
It can also be deduced from a ColorMap object.
fig.draw_trajectory(traj) # Default style
fig.draw_trajectory(traj,ColorMap.haxby()) # haxby color map
fig.draw_trajectory(traj); // Default style
fig.draw_trajectory(traj,ColorMap::haxby()); // haxby color map
fig.draw_trajectory(traj) % Default style
fig.draw_trajectory(traj,ColorMap().haxby()) % haxby color map
In addition, optional arguments can be passed to the StyleGradientProperties object to define line style, line width, layer and Z-value.
For more information, see Optional arguments.
fig.draw_trajectory(traj, StyleGradientProperties(ColorMap.haxby(), "..", "layer1", "w:0.1", "z:1.5"))
# haxby color map, dotted line, line width of 0.1, z-value of 1.5 and on layer1
fig.draw_trajectory(traj, StyleGradientProperties(ColorMap::haxby(), "..", "layer1", "w:0.1", "z:1.5"));
// haxby color map, dotted line, line width of 0.1, z-value of 1.5 and on layer1
fig.draw_trajectory(traj, StyleGradientProperties(ColorMap().haxby(), "..", "layer1", "w:0.1", "z:1.5"))
% haxby color map, dotted line, line width of 0.1, z-value of 1.5 and on layer1
Optional arguments
For every constructor of StyleProperties and StyleGradientProperties, optional arguments can be passed to define a line style, a line width, a layer and/or a Z-value.
Note that these four arguments are optional, only the desired ones can be added and they can be added in any order.
Line style
A string can be passed to define the line style (default is solid).
- Available line styles are:
"-"(solid)"--"(dashed)".."(dotted)"-."(dash-dotted)"-.."(dash-dot-dotted)
Line width
A string starting with "w:" followed by a float can be passed to define the line width (default is 0)
Z-value
Warning: the Z-value has been added to VIBes since version v0.3.4, please update to this version (or higher) for the Z-value to work
A string starting with "z:" followed by a float can be passed to define the Z-value (default is 0)
This Z-value represents the height of an object : the higher the Z-value, the higher the object will be. An object with a Z-value of 0.5 will be drawn on top of an object with a Z-value of 0, but behin an object of Z-value 1.
Notes
Some objects have a non-null default Z-value.
Tubes are by default drawn at
z=-1- On pavings (and in the corresponding predefined styles)
Outside boxes are drawn at
z=-3Boundary boxes are drawn at
z=-2Inside boxes are drawn at
z=-1
Layer
A string can be passed to define the layer to draw on (default is “alpha”).
Note that this case is the last as it is the “fallback” case :
if the string is not a line style and does not start with "w:" or "z:", it is a layer name.
Note that these layers are only used in IPE (see The IPE editor). Only the layers for paving are converted as VIBes groups.
Notes
On pavings and in the corresponding predefined styles
Outside boxes are drawn on layer
outsideBoundary boxes are drawn on layer
boundaryInside boxes are drawn on layer
inside