See also
This manual refers to Codac v1, but a new v2 implementation is currently in progress… an update of this manual will be available soon. See more.
The VIBes viewer
The graphical classes provided in Codac are based on the VIBes viewer: a visualization system that aims at providing people working with intervals a way to display results (boxes, pavings), without worrying about GUI programming. Some methods have been implemented in Codac in order to extend VIBes’ features to tubes purposes.
Installation
For the installation of VIBes, please refer to the installation page of this library: Graphical tools.
Launch VIBes
VIBes is an independent program that has to be launched together with the executable of your project.
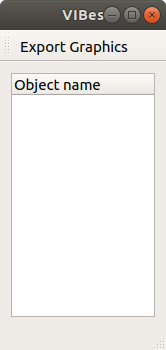
The first thing to do is launch VIBes. This will make appear the VIBes window, ready to display things (keep it open!):
To start and end the communications with the server, one should include:
beginDrawing()

# ...

endDrawing()
vibes::beginDrawing();

// ...

vibes::endDrawing();
The VIBes API
The VIBes API is available for both C++ and Python:
Codac provides custom classes to extend VIBes’ features to appropriate drawings of tubes:
VIBesFig: parent classVIBesFigTube: view for 1d tubes and/or trajectoriesVIBesFigTubeVector: view for n-d tubes and/or trajectoriesVIBesFigMap: 2d view of projected tubes and trajectoriesVIBesFigPaving: 2d view of projected pavings
The VIBesFig class
The interface of this class comes from the features of VIBes. However, the original VIBes API cannot be directly used on the VIBesFig objects.
Instead, one should use the following features:
Create a VIBesFig object
The following:
fig = VIBesFig("Figure name")
fig.set_properties(100, 100, 400, 200)
fig.axis_limits(IntervalVector([[0,10],[0,5]]))
VIBesFig fig("Figure name");
fig.set_properties(100, 100, 400, 200);
fig.axis_limits(IntervalVector({{0.,10.},{0.,5.}}));
creates a figure with:
name: Figure name
size: \(400\times200\)
position of upper-left corner: \((100,100)\)
view area sets to: \([0,10]\times[0,5]\)
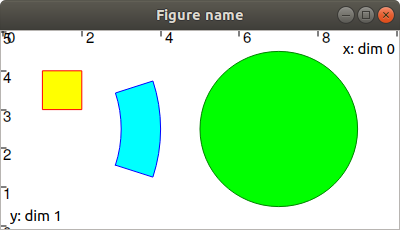
Drawing boxes
x = IntervalVector([[1,2],[3,4]])
fig.draw_box(x, "red[yellow]")
IntervalVector x({{1,2},{3,4}});
fig.draw_box(x, "red[yellow]");
Drawing circles
fig.draw_circle(7, 2.5, 2, "darkGreen[green]")
fig.draw_circle(7, 2.5, 2., "darkGreen[green]");
Drawing pies
r = Interval(3,4)
theta = Interval(-math.pi/10,math.pi/10)
fig.draw_pie(0, 2.5, r, theta, "blue[cyan]")
Interval r(3.,4.);
Interval theta(-M_PI/10.,M_PI/10.);
fig.draw_pie(0., 2.5, r, theta, "blue[cyan]");
The above commands produce:
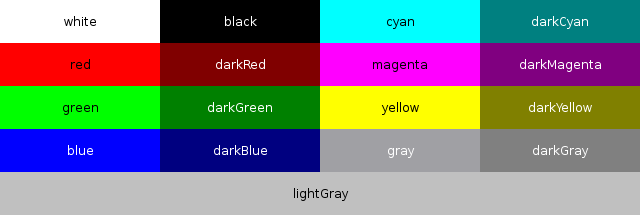
Color conventions
The color code use in VIBes is edge_color[fill_color].
The edge_color and fill_color may refer to predefined colors or to custom shades.
The default values are black edges and no filling.
Predefined colors are:
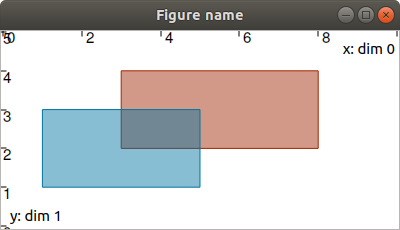
For custom colors, the HTML color code can be used. In the following example, the two last digits (77) add a alpha component to the colors for transparency. These last values may be chosen between 00 (transparency) and FF (opacity).
fig.draw_box(IntervalVector([[3,8],[2,4]]), "#A02400[#A0240077]")
fig.draw_box(IntervalVector([[1,5],[1,3]]), "#0074A0[#0074A077]")
fig.draw_box(IntervalVector({{3,8},{2,4}}), "#A02400[#A0240077]");
fig.draw_box(IntervalVector({{1,5},{1,3}}), "#0074A0[#0074A077]");