See also
This manual refers to Codac v1, but a new v2 implementation is currently in progress… an update of this manual will be available soon. See more.
Display tubes and trajectories w.r.t. time
This page presents a tool for displaying tubes and trajectories objects with respect to time.
The class VIBesFigTube
VIBesFigTube creates a figure for displaying temporal objects such as trajectories and tubes. The x-axis of this 2d figure is time.VIBesFig: the methods provided in VIBesFig can be used here.To create and show a \(600\times300\) figure located at \(100,100\):
fig = VIBesFigTube("Tube")
fig.set_properties(100, 100, 600, 300)

# add graphical items here ...

fig.show()
VIBesFigTube fig("Tube");
fig.set_properties(100, 100, 600, 300);

// add graphical items here ...

fig.show();
To add temporal objects (before the method .show()), use the methods .add_tube() or .add_trajectory() with three arguments:
the first argument refers to the object to be shown
the second one is the name of the object in the view
(optional) the third argument defines the color of the object (
edge_color[fill_color])
fig.add_tube(tube_x, "x", "blue[yellow]")
fig.add_trajectory(traj_x, "x*", "red")
# Where tube_x and traj_x are respectively Tube and Trajectory objects
fig.add_tube(&tube_x, "x", "blue[yellow]");
fig.add_trajectory(&traj_x, "x*", "red");
// Where tube_x and traj_x are respectively Tube and Trajectory objects
// In C++, the first argument is a pointer to the object to display
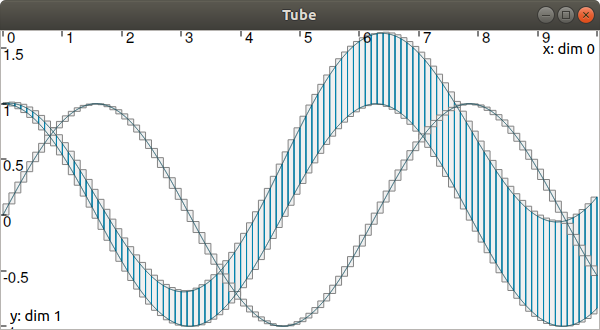
Draw slices
The .show() method accepts a boolean argument. If set to true, then the slices of the tubes will be displayed (instead of a polygon envelope).
For instance:
dt = 0.1
tdomain = Interval(0,10)

traj = TrajectoryVector(tdomain, TFunction("(sin(t) ; cos(t) ; cos(t)+t/10)"))
y = Tube(traj[0], dt)
x = Tube(traj[1], traj[2], dt)

beginDrawing()

fig = VIBesFigTube("Tube")
fig.set_properties(100, 100, 600, 300)
fig.add_tube(x, "x", "#376D7C[lightGray]")
fig.add_tube(y, "y", "#7C4837[lightGray]")
fig.add_trajectories(traj, "trajs")
fig.show(True)

endDrawing()
float dt = 0.1;
Interval tdomain(0,10);

TrajectoryVector traj(tdomain, TFunction("(sin(t) ; cos(t) ; cos(t)+t/10)"));
Tube y(traj[0], dt);
Tube x(traj[1], traj[2], dt);

vibes::beginDrawing();

VIBesFigTube fig("Tube");
fig.set_properties(100, 100, 600, 300);
fig.add_tube(&x, "x", "#376D7C[lightGray]");
fig.add_tube(&y, "y", "#7C4837[lightGray]");
fig.add_trajectories(&traj, "trajs");
fig.show(true);

vibes::endDrawing();
which produces:
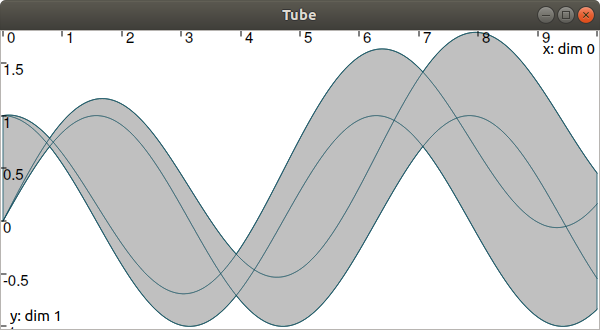
Draw a set of objects on the same figure
Several objects can be drawn on the same figure with successive calls to the .add_...() methods. It is also possible to project all components of a vector object on the same figure with .add_tubes() or .add_trajectories().
The following code:
dt = 0.001
tdomain = Interval(0,10)

f = TFunction("(cos(t) ; cos(t)+t/10 ; sin(t)+t/10 ; sin(t))") # 4d temporal function
traj = TrajectoryVector(tdomain, f) # 4d trajectory defined over [0,10]

# 1d tube [x](·) defined as a union of the 4 trajectories
x = Tube(traj[0], dt) | traj[1] | traj[2] | traj[3]

beginDrawing()

fig = VIBesFigTube("Tube")
fig.set_properties(100, 100, 600, 300)
fig.add_tube(x, "x", "#376D7C[lightGray]")
fig.add_trajectories(traj, "trajs")
fig.show()

endDrawing()
float dt = 0.001;
Interval tdomain(0.,10.);

TFunction f("(cos(t) ; cos(t)+t/10 ; sin(t)+t/10 ; sin(t))"); // 4d temporal function
TrajectoryVector traj(tdomain, f); // 4d trajectory defined over [0,10]

// 1d tube [x](·) defined as a union of the 4 trajectories
Tube x = Tube(traj[0], dt) | traj[1] | traj[2] | traj[3];

vibes::beginDrawing();

VIBesFigTube fig("Tube");
fig.set_properties(100, 100, 600, 300);
fig.add_tube(&x, "x", "#376D7C[lightGray]");
fig.add_trajectories(&traj, "trajs");
fig.show();

vibes::endDrawing();
produces:
The class VIBesFigTubeVector
More content coming soon.